MVRV Danger (Overvaluation) Zone
Definition
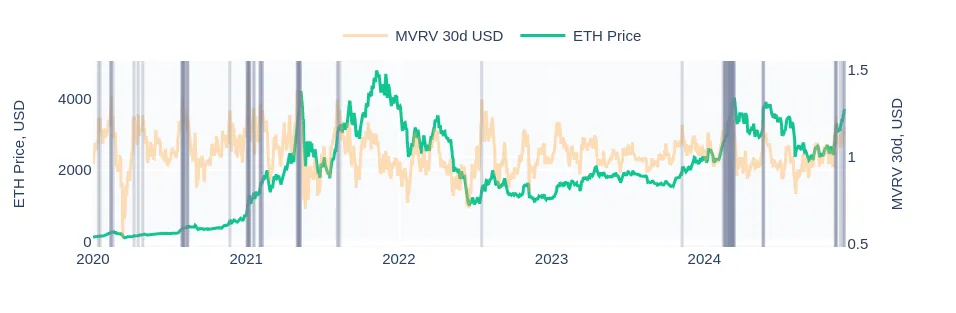
MVRV Danger (Overvaluation) Zone anomaly is triggered when the MVRV metric suggests that the asset is overvalued, indicating a potential risk of market correction. This anomaly activates when the current MVRV value exceeds the upper threshold based on historical MVRV spikes over the recent period. It helps investors assess when the market may be becoming over-leveraged, signaling a heightened risk of asset overvaluation.
Use Cases
- MVRV can help institutional investors gauge market liquidity and risk exposure. Spikes in MVRV ratios can indicate that the market is becoming over-leveraged, while dips may signal safer entry points.
- Long-term investors can use MVRV to track market cycles and identify when it might be wise to enter or exit positions.
- The MVRV Danger Zone Data Anomaly becomes even more powerful when used in conjunction with the MVRV Opportunity (Undervaluation) Zone Data Anomaly. While the Opportunity Data Anomaly identifies undervaluation and potential accumulation points, the Danger Anomaly warns of potential overvaluation and the risk of a price correction. By leveraging both anomalies, you can strategically time their entry and exit points.
SanAPI
Available under names: mvrv_usd_30d_upper_zone, mvrv_usd_60d_upper_zone, mvrv_usd_180d_upper_zone and mvrv_usd_365d_upper_zone.
The example below uses the 30-day variant; replace 30d in the name with 60d, 180d or 365d to query the other variants.
Example of query for the number of times the anomaly fired for bitcoin between the from and to dates:
{ getSignal(signal: "mvrv_usd_30d_upper_zone") { aggregatedTimeseriesData( selector: { slug: "bitcoin" } from: "utc_now-90d" to: "utc_now" ) }}